January 2023
Chart of the Quarter
S&P 500 Index Post-War Recession and Non-recession Bulls Scenarios for 2023
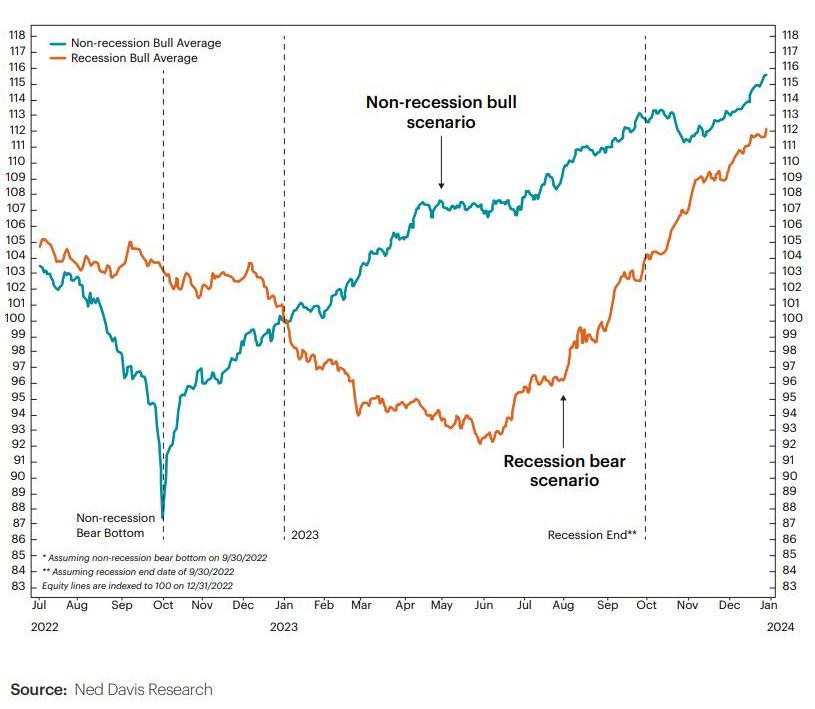
Historical data can tell us about what has occurred, but it can only provide a foundation for what may happen in the future. It is worth noting two phenomena related to the stock market and recessions. First, bear markets have never ended before the start of a recession, and the stock market tends to lead the economy out of a recession. This information is essential when we examine the Chart of the Month. The orange and blue lines in the diagram above represent two average composites of opposing possibilities. The blue line indicates that if the Fed succeeds in achieving a soft landing, 2023 might be the year of a post-recession bull rally. In other words, the 2022 low is the cycle low. In comparison, the orange line represents recession bear markets. According to Ned Davis Research, a recession will finish by September 30, 2023, corresponding to markets falling before the recession and leading out of it. Although no crystal ball can forecast the coming twelve months, a volatile first half of the year followed by a potential second half rebound cannot be ruled out.