April 2023
Chart of the Quarter
 Source: Bloomberg
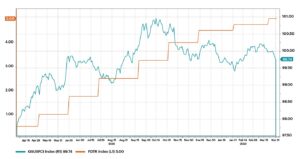
The above chart compares the Goldman Sachs U.S. Financial Conditions index (teal) to the Fed Funds rate’s upper bound (orange). The higher the blue line, the better the financial conditions (looser conditions), and vice versa. According to the Goldman Sachs U.S. Financial Conditions index, conditions continue to tighten as economic activity slows. Financial conditions represent the availability of financing in an economy and are directly linked with future growth. Looking at this chart, one can discern a protracted slowing in growth that is runningbelow the upper bound of the Fed Funds rate. Has growth slowed enough to warrant a halt in rate hikes? We’ll have to wait and see where inflation goes before the next Fed meeting. Yet it appears that we are getting closer.