Evidence Based Investing for High & Ultra-High Net Worth Investors
A disciplined framework for optimal, penalty-resistant investing in the 21st Century.
EXECUTIVE SUMMARY
Overwhelming evidence shows that virtually all investors underperform market averages by a significant margin.
For investors with large portfolios, this “Investor Behavior Penalty” becomes even more significant because of the dollars involved. What can be a modest penalty for the average investor can dramatically impact the wealth accumulation, retirement income streams and financial endurance levels of high (those with working investment assets of $1-$20 million) and ultra-high net worth investors (those with portfolios exceeding $20 million.)
Based on extensive internal research, along with credible external studies, Janiczek & Company, Ltd. has concluded that no single instrument can help investors make clear judgments in a chaotic, information saturated environment. Rather, the combination of two disciplines form the framework for comprehensive investment and wealth management:
Discipline #1: Evidence Based Investing (EBI)
Evidence Based Investing (EBI) is designed to filter through the noise, information, hype and emotion in the marketplace in order to make reasoned investment decisions and void of as much Investor Behavior Penalty as possible.
Discipline #2: Strength Based Wealth Management™ (SBWM)
Strength Based Wealth Management (SBWM) focuses on the financial factors that can optimally enhance an investor’s strength, durability, agility and endurance, seeking to minimize vulnerabilities and further immunize them against the Investor Behavior Penalty.
This paper concentrates on Evidence Based Investing and briefly summarizes how the complimentary discipline of Strength Based Wealth Management (covered in detail in other papers published by Janiczek®) provides high and ultra-high net worth investors with:
- A powerful two-pronged approach to defend their portfolios from costly penalties and unforced errors.
- A sensible way to liberate themselves from the noise, hype and emotions at the root of common investment mistakes.
- A prudent way to take advantage of opportunities that may elude unprepared or uninformed investors.
Introduction
THE INVESTOR BEHAVIOR PENALTY
Investors of all net worth classifications and levels of investing knowledge fall prey to the Investment Behavior Penalty. Even the most intelligent and accomplished high and ultra-high net worth individuals make investment decisions that are contrary to their own best interests. They trade when they should hold, reserve cash when they should invest, or buy and sell at precisely the wrong time or at unadvisable costs and constraints. Various factors may contribute:
- They have never developed a comprehensive investment or wealth management strategy.
- They follow the counsel of biased advisors who represent and/or are compensated to promote investment vehicles or approaches that are, under the strict standards of Evidence Based investing, penalty prone or laden.
- Most likely, they succumb to the vast quantities of noise, information, hype and emotion perpetuated by the Internet and the 24/7 financial news cycle.
Regardless of the cause, what is the consequence of the Investor Behavior Penalty?
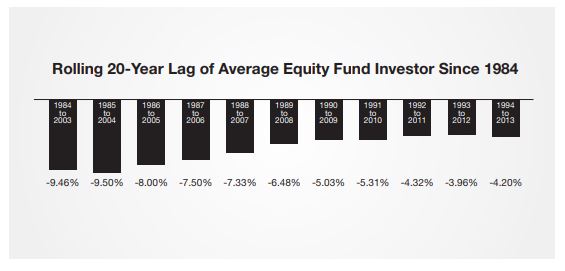
Comprehensive studies, such as the annual Dalbar, Inc. QAIB study, now in its 20th year, reveal the severe underperformance level of the average investor. This study has revealed that equity investors lagged the S&P 500 index anywhere from 3.96% to 9.46% annually over every rolling 20-year period since 1994.1
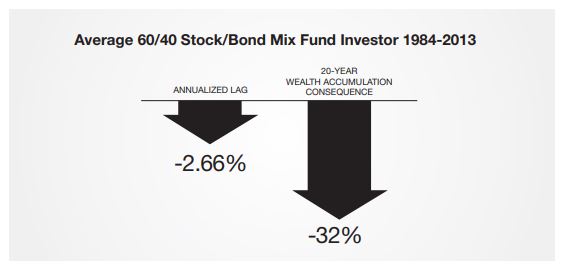
Since high and ultra-high net worth investors are not typically 100% allocated to equities, we examined the year-by-year performance lag of both equities and fixed income (bond) investors, using the Dalbar data as a basis. Our study revealed that over the last 20 years (1994 thru 2013), the average moderate/aggressive (60% stock/40% bond) investor would have experienced a 2.66% annual lag compared to directly investing in the S&P 500 Index and Aggregate Bond Index, a combined 32% lag over the two decades studied.
To illustrate the consequences of the IBP over time, consider an investor with a $5 million portfolio, adding $500,000 annually for 20 years (1994 to 2013.) The consequences are significant. This hypothetical ultra high net worth investor realized $33 million instead of $49 million, a $16 million deficit.
This white paper will explore this all-too-common phenomenon, and offer a comprehensive framework designed to give investors the highest probability of avoiding – or at least minimizing – the Investor Behavior Penalty. It provides substantiation for each of the five components of Evidence Based Investing:
- Asset Allocation
- Security Selection
- Trading & Rebalancing
- Tactical Adjustments
- Investment Review
ASSET ALLOCATION
No single input is more important to a portfolio’s success than determining how much to allocate to various asset classes.
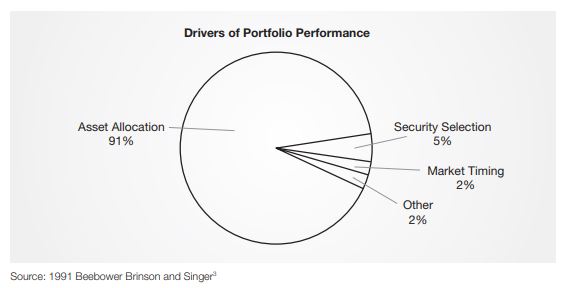
In 1986, authors Gary Brinson, Gilbert Beebower, and Randolph Hood conducted an in-depth study of the various sources of investment returns. Specifically, they analyzed quarterly returns from 1974-1983 for the 91 largest pension funds, and determined that 93.6% of the returns generated were a result of asset allocation. 2
In a follow-on study in 1991, the authors concluded that 91% of portfolio returns are determined by asset allocation.
Modern Portfolio Theory
This was not the first time that the research highlighted the importance of asset classes in determining investment performance. Decades earlier, Harry Markowitz’s 1952 journal article, “Portfolio Selection,” introduced Modern Portfolio Theory (MPT) to the financial community. MPT provided investors with a methodology for building portfolios that would maximize expected returns though proper diversification. Markowitz showed that combining different assets, whose expected returns are not correlated (such as stocks and bonds), achieved a higher overall return for the portfolio.4
The benefit of balancing diversified assets within a portfolio is a result of the interaction between the two asset classes. Stocks and bonds are negatively correlated, in that their returns tend to move in opposing directions. Stocks have greater returns but greater risks. Bonds rarely generate negative returns, but they will lag stocks when stocks are experiencing strong returns. When stocks decline, bonds benefit the portfolio by providing positive returns while simultaneously reducing portfolio volatility.
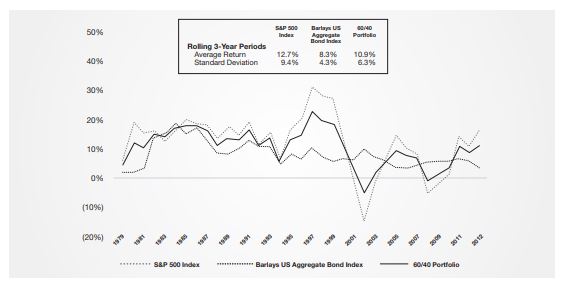
The chart below shows how an all-stock allocation has historically produced a rolling 3-year return of 12.7%, which diminishes to 10.7% when bonds are added, a 14% reduction. More importantly, this diversified stock/bond portfolio results in volatility declining 33% (from 9.4% to 6.3%). The risk reduction gained in the portfolio is more than twice the performance lost, an attractive trade-off compared to the original all-stock portfolio.5
The rise of alternative investments
In recent years, a third asset class has become more commonly added to the traditional portfolio containing stocks, bonds and cash. Alternative investments are those that exhibit risk and returns that do not behave like a stock or a bond. Examples include assets (commodities, real estate, private equity, fine art) or strategies (long/short, short-selling, event-driven, leveraged.) By adding this third leg to the asset allocation stool, an investor can further improve the risk-reward trade-off.6 The impact of alternatives at various allocations can affect a portfolio’s risk and return, as illustrated by the graph below:
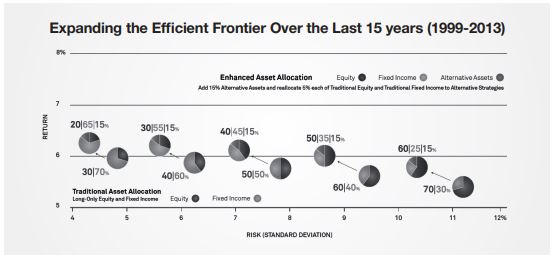
KEY INSIGHT #1: A properly constructed and managed asset alloca- tion is proven to enhance the risk/reward characteristics of a portfolio and is far more influential on performance than security selection and market timing by a factor of 9 to 1.
SECURITY SELECTION
Passive investing as the foundation for an optimal portfolio
To investors who have spent years accumulating wealth through active entrepreneurship or business management, the notion of being “passive” may have a negative connotation. But
when designing a portfolio strategy, evidence suggests that passive investing produces superior results with lower expenses than one built around active trading.
In a passive investment strategy, an investor is not looking to beat the market. Rather, the goal is to gain exposure to the broader market – all the good and all the bad – at the lowest possible cost.7
The broader market is represented by indices, for example the Standard & Poor’s 500 Index for stocks and the Barclays Aggregate Bond Index for bonds. Investors do not buy into an index
per se, but in funds that closely mimic the index.
In the investment management world, there are marketplaces in which assets are efficiently priced, and the odds of outperforming those markets’ respective indexes are small. The vast
majority of studies documenting active managers’ track records conclude that 60%-85% of active managers fail to beat their respective benchmarks over the long term.5 The most commonly cited factors include:8
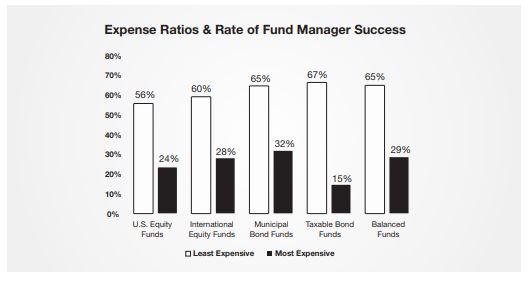
Fees. The average domestic equity manager will cost 0.80% to 1.40% of an investor’s assets, while the equivalent passive security (index fund or ETF) will cost 0.10% or less. The difference in fees is strikingly similar to the underperformance gap of active managers uncovered by several research studies.9
Investment research firm Morningstar studied the relationship between fees and investment performance over a 5-year period ending June 30, 2008. Their defined “success rate” as “the percentage of funds that not only survived but also outperformed.” Clearly the cost of the active manager plays a significant impact on the future success.10
“Closet Indexing.” Research confirms that most managers are mirroring their benchmarks more than ever. According to New York University professor Yakov Amihud, the returns of
the median actively managed fund are 93% correlated with those of the overall market. By mirroring the market, the typical active fund is effectively an expensive ‘closet index’ fund. Dr. Amihud’s study further shows that, for every 10% reduction in this relationship, investors can expect an increase in returns of 0.8% annually.11
Further, Yale Professors K. J. Martijn Cremers and Antti Petajisto find a negative relationship between the size of a fund and its active share. In other words, the larger the fund, the more likely it is to be a closet indexer. While some of this may be for the simple reason that it has more money to deploy within a certain space, another factor may play a role: compensation. Fund size results in more revenue and incrementally lower costs for the fund manager. Unfortunately, this may put the interests of the fund manager at odds with those of the fund’s investors.12
We discuss opportunities for generating alpha (return in excess of benchmark) later in this paper, but suffice is to say that closet index funds deliver benchmark-like returns at 10 times the cost of the passive alternative, and should be avoided.
Passive strategies play a very important role in most portfolios. For many markets, securities are highly efficiently priced, so reducing costs and gaining broad exposure via passive securities serves as a great foundation for one’s portfolio
Limitations to Passive Indexing
Passive investing does have its limitations. First, you’re guaranteeing a slight underperformance versus the benchmark due to the expenses of the passive security. Granted the lag is small, but investors will never outperform the index.
More importantly, selecting a passive security in which to invest still requires some research. For example, traditional stock indices are market-capitalization weighted. This means that as a stock becomes more expensive (and potentially riskier), it gains a larger weight in the index. Bond indices present a similar issue: The more debt a company or country issues, the greater the weight they have in the index. But is a passive bond investor’s goal to gain exposure to the most leveraged companies or countries in the market?
While the creation of new indices has helped overcome these drawbacks, they may have introduced a new problem. Let’s say a new index equal weights its components. Further, in order to, remove other risks, perhaps the index limits its components to higher quality issuers only. By eliminating presumed risks, the new indices are effectively making an actively managed decision.
“Active Share” insights from Yale
The collective failure of active managers to beat their benchmarks has been well researched and documented. That said, a relatively new measure introduced in 2009 by two professors from the Yale School of Business provides investors with a new tool for selecting active managers. Their report entitled “How Active Is Your Fund Manager? A New Measure That Predicts Performance” defined active share as the percentage of stocks in a portfolio that differ from the portfolio’s benchmark. For example, let’s say a manager is benchmarked to the S&P 500 Index, but the manager owns none of the 500 stocks in that index. His active share would be 100%. Conversely, if a manager owns all 500 stocks in the S&P, his active share would be 0% – a classic “closet index.”13
Examining over 2,500 mutual funds from 1980-2003, the professors found that the managers with the greatest active share outperformed their benchmarks by 1.13% annually, net of fees. Conversely, the managers who looked the most look like their benchmarks generated returns that lagged by 1.42% annually, net of fees. The authors also found managers increasingly migrating to the “closet index” camp over time. The percentage of funds with active share over 80% fell from 58% in 1980 to just 28% in 2003, while those with active share of less than 60% rose from 1.5% to 40.7%, respectively.
This study went on to confirm that funds with a stated objective of running portfolios with fewer, concentrated positions (often called “focused”) have greater active share and, therefore greater alpha (an indication of the value added by the active manager) net of fees. Although the study didn’t study the impact of taxes, it logically follows that a concentrated portfolio benefits from lower trading costs and taxable capital gains since it has fewer positions to trade. Examining the data from another perspective, we find that small- and mid-cap managers tend to have greater active share and, therefore, greater alpha net of fees, since there are far more small company stocks to choose from than large ones.
Active management works best in less efficient markets
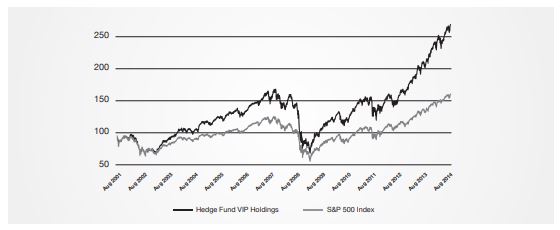
Similar results can be found among less regulated money managers, such as hedge funds. David Kostin of Goldman Sachs has tracked 775 hedge funds, with aggregate equity positions totaling $1.9 trillion, since 2001. Hedge funds typically seek hidden value in more obscure, less efficient or less popular stocks. By examining the equity positions that appear most frequently among the top 10 holdings (what Kostin calls the “stocks that matter most”), we see the stocks in which hedge fund managers have the greatest convictions.14
The track record of this list indicates that managers who have the ability and freedom to uncover value in the market can add to investment returns. Since the data began in 2001, the hedge funds’ top picks have returned 193.4%, or 8.6% per year. This strong performance beats the S&P 500 Index’s 108.5% return, or 5.7% annualized. Over 14 calendar years (including partial year data for 2001 and 2014), the hedge funds’ top picks have outgained the S&P 500 71% of the time.
Key Insight #2: In efficient markets where the odds of outperforming the benchmark are small, investors are better served by taking a broad passive approach. They gain the exposure to the asset class they desire, and do so at the lowest cost. In less efficient markets, investors could benefit from a carefully selected manager who seeks truly active management.
Selecting active money managers
Given that active management is an appropriate tactic for portions of a portfolio, selecting and monitoring the right active manager is essential. The process could easily be the subject of a separate document, but for the purpose of this white paper, we’ll summarize key areas that should be researched:
- Active Share Assessment – In light of the previously discussed research from Yale, what is the active share measurement of the managers being considered? Which managers are closet indexers (to be avoided) and which ones truly add value to a portfolio?
- Process & methodology – What is the underlying philosophy that goes into the active manager’s process? How does the manager select securities? What is the process to remedy an investment that has soured? The more disciplined the process, the better, but only if the disciplined actions are based upon a sound philosophical foundation.
- Portfolio manager(s) & analysts – Does the fund have a tenured portfolio manager who has been through multiple market cycles? Is the process dependant on a key individual, or is there a team of experienced managers in place? If qualitative analysis is involved, how experienced are the analysts?
- Organizational structure – Is the firm a specialist in a particular asset class, or is it an investment generalist? Are managers allowed to live and die by their decisions, or is there portfolio management input from above? Do the portfolio managers have their own money invested in the fund, i.e., do they have “skin in the game?”
- Performance – Past performance must show a long-term track record of delivering results that, net of fees, beat the passive index. It must also include an understanding of how those results were achieved. In short, was the performance the result of skill or luck?
- Role in Portfolio – Finally, how will this investment fit within the existing portfolio? Is the manager similar to the portfolio’s existing managers, thereby adding little risk/reward benefit? Or are there benefits to be gained by adding a manager that zigs while the others zag? This question can be assessed with the right quantitative tools, but only if the question is part of the process in the first place.
Key Insight #3: Investors should have the confidence that their process for selecting and retaining investments is thorough and robust, including all six categories of money manager evaluation identified in this paper.
Trading & Rebalancing
The role of tax strategies in trading and managing investment portfolios
“Avoidance of taxes is not a criminal offense. Any attempt to reduce, avoid, minimize, or alleviate taxes by legitimate means is permissible. The distinction between evasion and avoidance is fine yet definite. One who avoids tax does not conceal or misrepresent. He shapes events to reduce or eliminate tax liability and upon the happening of the events, makes a complete disclosure. Evasion, on the other hand, involves deceit, subterfuge, camouflage, concealment, some attempt to color or obscure events, or making things seem other than what they are.” — Internal Revenue Service15
Certain tax strategies can add a meaningful boost to portfolio performance because taxes are an explicit cost to any portfolio and, therefore, a detractor from performance. Although tax situations are unique to each individual, any strategy that limits or delays the tax bill and retains more after-tax return for investors will face little argument.
Assuming all investors pay taxes either now or later, the chart below illustrates the benefit of delaying taxes. We assume a portfolio of 60% stocks, 40% bonds that is rebalanced every year. The solid line depicts the growth of the 100% taxable portfolio, while the dotted line shows portfolio growth in a 100% tax-deferred portfolio. Of course, the taxman arrives eventually, so we show the hit (a worst-case all-at-once tax consequence) to the tax-deferred line when withdrawing at ordinary income tax rates.
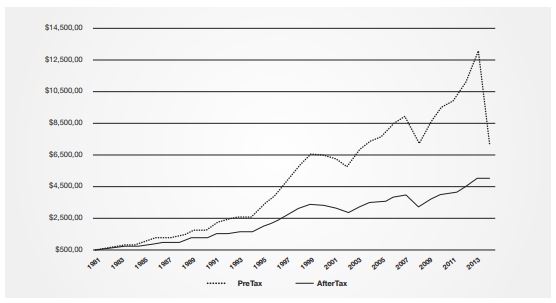
The chart shows that deferring taxes results in a 42% larger portfolio. Since we used actual market data, an investor who began with $500,000 in 1981 would have $2.1 million more after taxes by the end of 2013.16
This analysis shows how a simple tax strategy – asset location – can have a dramatic impact on one’s portfolio. By deliberately selecting the account type in which a specific investment resides, investors can control the amount of the annual tax burden. Investors in higher income tax brackets will benefit from placing high yielding assets that generate taxable income into tax deferred accounts (such as IRAs) and avoid paying ordinary income tax for years until the money is withdrawn.
Tax strategies beyond qualified accounts
In other cases, higher yielding income securities come with built-in tax advantages that will help determine their best location. Municipal bonds offer interest income that is often exempt from both federal and state incomes taxes, so holding these securities in taxable accounts will allow the investor to take advantage of this characteristic. Conversely, taxable bonds are best positioned in tax-deferred accounts.
Private partnerships that make distributions to its limited partners also offer attractive tax opportunities. Those distributions typically represent return on investors’ capital and are subject to each investor’s ordinary income tax rate. A partnership’s accountant will annually determine if any of the distributions made that year represent the return of capital, which would reduce the investor’s cost basis rather than producing taxable income.
Tax loss-harvesting is another common strategy. The trade involves selling an asset at a loss, then repurchasing the asset in 31 days. Doing so allows the investor to claim the loss according
to IRS guidelines, offsetting gains elsewhere and reducing the investor’s overall tax burden. The investor must not repurchase the asset earlier or else the wash sale rule makes the loss unusable.
The key here is to be strategic. Harvesting losses comes with the downside of increased trading costs. However, if an investor has the ability to lower a big capital gain by harvesting an offsetting loss, the impact on taxes and therefore after-tax returns over time is meaningful.
Key Insight #4: Tax strategies play a key role in the investment process. They can lower the cost of managing investments, thereby maximizing the after-tax return. It’s important to note that tax avoidance should not be a top priority. After all, having a sub-optimal portfolio just to keep taxes at or near zero is akin to having the proverbial tax tail wag the investment dog. But since taxes are a real cost to the portfolio, having an investment process that proactively and continually addresses this optimization opportunity increases the odds of investment success.
The optimal frequency for portfolio rebalancing
Markets re-price every day, with certain asset classes performing better than others at any given time. As a result, the asset allocation of one’s portfolio will be constantly changing. Rebalancing the investment portfolio on a regular basis ensures that investments are aligned with long-term asset allocation targets.
The basic goal of a portfolio rebalance is to sell or trim the assets that have outperformed their benchmark and are, therefore, larger than the intended target. The gains realized would be used to buy the lesser performing assets and bring them up to the intended target allocation. The underlying philosophy, often referred as “reversion to the mean,” is that, as business cycles and investment cycles play out, today’s laggards are likely tomorrow’s leaders.
Rebalancing too frequently racks up trading costs and tax ramifications, while not rebalancing often enough results in a portfolio that can be significantly out of line with desired allocation and risk levels. So what is the optimal frequency for portfolio rebalancing? Much research has been conducted on this topic, but many conclude that 13 months is a reasonable time period. This period is deliberately longer than one year and, as a result, means that any gains realized through rebalancing would be taxed at the lower, more favorable long-term capital gains rate.17
But let us be clear that rebalancing to a target asset allocation is only as good as the asset allocation plan, and tactical adjustments made to the plan on an ongoing basis, based upon prevailing circumstances. For instance, if a long-term plan called for a certain neutral allocation to fixed-income securities, say 30%, but prudent tactical allocation inputs lowered the target to 20% due to record low interest rates (and an elevated probability of rates rising), what is the wealth manager to do? The portfolio in such an instance should only be rebalanced to the prevailing 20% mark, not the long term 30% target.
KEY INSIGHT #5: Thirteen months is a reasonable frequency for portfolio rebalancing, but only when incorporated with prudent asset allocation and tactical asset allocation methodologies.
TACTICAL ADJUSTMENTS
In their 1986 asset allocation research, Brinson, Beebower, & Hood defined tactical asset allocation as:
“…strategically altering the investment mix weights away from normal in an attempt to capture excess returns from short-term fluctuations in asset class prices (market timing);”
When it comes to tactical asset allocation, a growing body of evidence shows investors who make tactical moves in their portfolios do best when both fundamental analysis and technical analysis align.
Technical analysis essentially believes that by analyzing certain factors that impact the price of a security (not necessarily the underlying company or issuer), one can gain information that enhances returns. It’s important to note that technical analysis is not a good predictive tool. By its very nature of looking at past prices, technical analysis will lag market prices in either up or down directions.
One final note on technical analysis pertains to time horizon. Technical analysis serves to inform investors about what is currently happening, or what has happened based on the most recent prices in any given market. Therefore, its use has focused on the short-term.
Once a pattern (momentum, relative strength, etc.) can be determined, investors take action. For longer-term time horizons, a different approach to security selection – fundamental analysis – is more relevant.
Fundamental analysis is the process by which investors research an issuer to derive a security’s true intrinsic value, and then look for times when the market believes it to be more or less than this intrinsic value. Over time, prices and value will converge. Fundamental investors typically analyze equities, although the practice can be applied to other securities as well.
Again, the question of whether technical or fundamental analysis is preferred for asset allocation is moot; both should be employed in order to achieve optimum results.
In 1996, investor James O’Shaughnessey published What Works on Wall Street, in which he tested various metrics and strategies to see which approach to investing generated the best returns. His conclusion was that a combination of attractive value metrics coupled with good momentum and trends performed best over long periods of time. While there are time periods in which certain factors play larger roles, utilizing both fundamental and technical indicators produced the highest returns.1
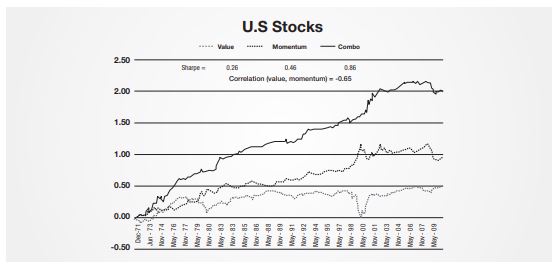
In 2006, hedge fund manager and NYU professor Joel Greenblatt published The Little Book That Beats the Market in which he shared his research and introduced what he called his “magic formula” for stock picking: Value plus Momentum as a superior approach. Greenblatt’s hedge fund, Gotham Capital, utilized his research to generate 40% annualized returns for its investors from 1985 to 2005.19
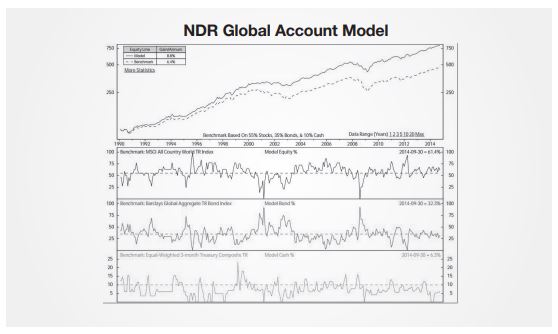
Institutional research firm NDR Research combines fundamental and tactical inputs into their asset allocation recommendations. In the firm’s words, “fundamental analysis tells what should be happening, and technical analysis tells what is happening.” Since markets can remain over or undervalued for years at a time, technical indicators are critically important in determining a change in trend. Utilizing this approach has helped the firm generate tactical asset allocation recommendations that have resulted in an additional 2.5% of gains per year.20
Tactical Adjustments within Asset Classes
Asset allocation should not be limited to the choosing among the major asset classes of stocks, bonds, or alternatives. In fact, the evidence is clear that allocating within asset classes has material impact on portfolio return.
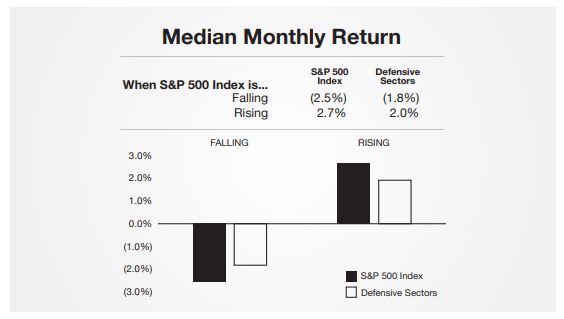
For example, within the U.S. equity market, investors may allocate between stocks in various economic sectors depending upon the current economic cycle. The utilities sector (electric utilities, regulated gas companies, etc.) tends to have very steady streams of earnings, making them less vulnerable to the highs and lows of the economic cycle. Conversely, consumer discretionary stocks (i.e. retailers, auto dealers, restaurants) are businesses that people either forgo during recessions or frequent more often during economic booms. As such their earnings can swing more than the economic cycle itself. By allocating equities between defensive versus cyclical stocks, investors can further improve their results.
We can observe the resiliency of these defensive sectors during down markets. In studying monthly returns since 1990, defensive sectors outperformed the S&P 500 75% of the time when the S&P 500 declined. Conversely, during months when the S&P 500 rose, these defensive sectors lagged 63% of the time. This evidence clearly shows how successful tactical allocation within equities can enhance investment returns.21
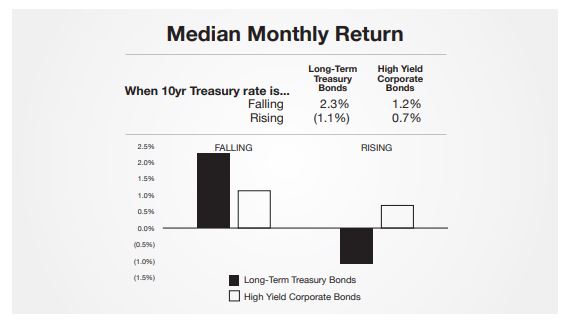
The same concept of allocating within an asset class holds within bonds. As the economic cycle turns higher, bonds of lower quality outperform as investors assume their credit rating may improve. Further, as investors prefer stocks to bonds while monetary policy begins to worry about rising inflation, interest rates tend to increase during economic upturns. Therefore, investors generally prefer shorter-term bonds to longer-term bonds. In recessions, the opposite is true: Long-dated, higher quality bonds post the best results. Investors with in-depth investment processes that include strong tactical asset allocation can reposition their portfolios and outperform the buy-and-hold investor over time. 22
Don’t assume your portfolio, wealth or fund manager will or can make timely tactical adjustments
Investors are often surprised to learn that they cannot expect timely tactical adjustments from their portfolio, wealth or fund manager. Mutual funds, with few exceptions, are designed to be fully invested in their defined asset class category with modest exceptions to account for cash reserves needed for daily redemptions. They may tactically adjust within sectors of their asset class category but typically not between asset classes. Portfolio and wealth management firms often do not have the philosophy or means to tactically adjust all client portfolios in a timely manner. A study by Curian Capital, LLC revealed that 69% of advisors did not change their clients’ portfolios in the face of market volatility.23
Our advice here is to ask questions. Is your advisor prepared to adjust client portfolios in the event of a crisis or an investment opportunity? Can they provide examples of how long it has taken them to execute portfolio adjustments across their client base? Are they equipped to trade quickly across all clients? You may be surprised what you learn.
INSIGHT #6: Investors with in-depth investment processes that include strong tactical asset allocation can reposition their portfolios and outperform the buy-and-hold investor over time. While there is a time and place for buy-and-hold, it is not a strategy for all investment seasons and all points in an economic cycle.
INVESTMENT REVIEW
The challenge of performance measurement
Periodic reviews of an investor’s portfolio helps ascertain whether the investment process is working, but more importantly, whether it’s on the right course for the individual investor.
The Beardstown Ladies was a 12-woman investment club that gathered monthly and managed their own stock portfolio. They became celebrities in the mid-1990s when news of their track record went viral: since their 1983 inception, The Beardstown Ladies claimed their portfolio had returned 23.4% versus the S&P 500’s 14.9% return. But in 1998, an audited performance record was released showing the club’s actual returns were actually 9.1% per year. 24
This example illustrates the fact that most investors simply don’t have proper performance data to assess their investments.
For individual investors who have frequent cash flows in and out of their accounts, a time-weighted return is the proper performance measurement. The time-weighted formula compares the periods of performance against the value of the account during that period in order to adjust for cash inflows and outflows. For example, if the value of the account increased due to a large deposit, the time-weighted return adjusts for this. As a result, the performance number is not reflective of the deposit, but rather the true performance of the underlying investments.
The main takeaway for the investor is not to become a skilled mathematician, adjusting and calculating for every dollar of cash flow. Rather, investors must require their wealth managers to show time-weighted returns so that an accurate assessment of the portfolio’s investments relative to their respective benchmarks is clear and informative.
Regular reviews help to determine if the portfolio’s active managers are delivering returns above their benchmark. If not, why not? Is there a large exposure in the portfolio that’s not performing? Was there an organizational change that impacted the portfolio manager’s ability to run the portfolio? Or is it too short a period to make a determination?
Far too often, investors observe positive results and stop reviewing their performance. But was the manager’s over-performance the result of the manager’s skill and expertise? Was it pure luck? Or did the manager deviate from the objective?
Case in point: In May, 2012, shares of Apple Computer Inc. were soaring. The stock had gained 65% the previous 12 months, and 357% the previous three years. Apple was the largest company in the S&P 500 Index and paid no dividends. However, a study by The Wall Street Journal found Apple shares were held by at least 50 mid- and small-cap funds, 40 dividend paying equity funds, numerous non-U.S. stock funds, and even one bond fund!15 The article quoted John Bogle, founder of Vanguard Group, stating: “It would clearly be inappropriate for a midcap fund to hold Apple. You’ve got to say that manager is violating his reason for being. I can’t help but believe that is going to end up in disappointment for his shareholders. I don’t know when, but it will.” 25
A periodic review must include not only the quantitative metrics within the portfolio, but also the qualitative assessment of the portfolio within an investor’s overall financial picture:
- Is the portfolio and its risk being managed within the investor’s overall wealth?
- Has anything changed outside of the portfolio that would warrant a change within the portfolio?
- If so, is this change being properly assessed and acted upon by the wealth manager?
Key Insight #7: Investors must require their wealth managers to show properly calculated time-weighted returns so that an accurate assessment of the portfolio’s investments, relative to their respective benchmarks, is clear and informative.
KEY TAKEAWAYS: EVIDENCE BASED INVESTING
Evidence Based Investing is designed to filter through noise, information, hype and emotion in order to make investment decisions void of as much Investor Behavior Penalty as possible.
Approaching investing in this manner can be a relief for investors. It minimizes the time-consuming meandering path of exploring multiple investment options – many of which are not ultimately successful – and concentrates their focus on higher probability of success approaches. It’s a sane, rigorous response to an uncertain future, particularly when pursued with:
- Objectively determined indicators
- Discipline (through good and bad times)
- Flexibility (shifting as evidence shifts)
- Risk aversion (controlling losses)
Negative Findings
- The Investor Behavior Penalty demonstrates the degree to which investors’ historical portfolio management has delivered poor returns.
- The debate over the merits of technical analysis and fundamental analysis is misguided: the evidence shows that combining both provides better results than either discipline on its own.
- Active management, in aggregate, has failed investors while benefitting the asset managers and their wholesalers.
- Evidence suggests that investors don’t deploy and/or have access to a proper investment review process that uncovers the drivers behind their returns.
Positive Findings
- Indexed-based investing optimally delivers market returns in most equity markets and should be the cornerstone of an investment strategy.
- The addition of alternative investments has historically reduced risk and increased the return of an investment portfolio.
- A thoughtful tactical allocation program between and within asset classes can add additional performance drivers.
- The evidence shows that investors can succeed with active managers in certain markets and with specific characteristics (i.e., high active share, low costs.)
- Tax strategies are dependent upon each investor’s unique tax situation, however, there are numerous strategies of which all investors can take advantage.
THE JANICZEK PERSPECTIVE
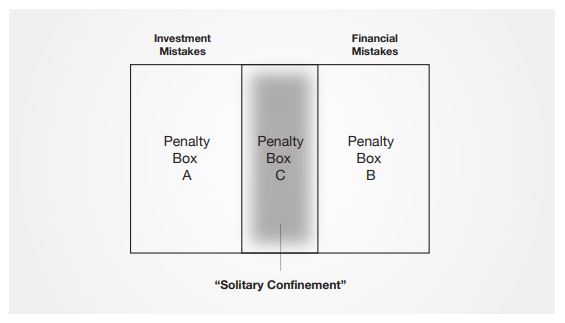
The Root Cause of the Investor Behavior Penalty
As previously stated, experience has led us to believe that the root cause of the Investor Behavior Penalty is the vast amount of noise, hype, information and emotion investors are required to filter through to make prudent investment and financial decisions.

We further define and categorize the consequences of this dilemma into Three Penalty Boxes in which we classify mistakes into investment mistakes (Penalty Box A), financial mistakes (Penalty Box B) and a combination of the two (Penalty Box C).
The Solution
The combination of Evidence Based Investing (EBI) and Strength Based Wealth Management (SBWM) is, in our view, the best practice solution to overcoming or minimizing the Investor Behavior Penalty.
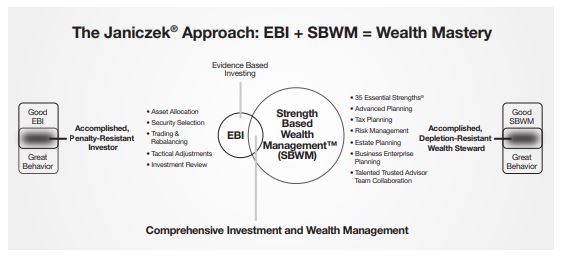
- Combine good EBI with great behavior, and we believe the investor could consider themselves an accomplished, optimal and highly penalty-resistant investor.
- Combine good SBWM with great behavior and we believe the investor could confidently consider themselves on top of their financial strength, agility, flexibility and endurance levels, to the point of enjoying a true sense of financial security and independence.
- Mix the two disciplines together, and we believe the investor could consider themselves an accomplished wealth steward, insulated from the Investor Behavior Penalty and confident of their financial future.
The Landscape
Finally, to be optimally effective, EBI and SBWM should not limit the extent of assets involved in both disciplines. Rather, it needs to recognize and optimize across the full landscape and hierarchy of high and ultra-high net worth investor wealth:
- Safety – Ensuring and protecting the wealth that has been established
- Market – Participating in market-like asset growth
- Aspirational – Exposing assets to the possibility of outsized gains that elevate net worth to a higher level.
Regardless of whether an investor is still accumulating wealth or is living off the fruits of their labors, managing investments in today’s global environment can be daunting. A comprehensive investment and wealth management process removes much of the uncertainty and mystery in achieving financial success.
This paper has focused on Evidence Based Investing. For more information on Strength Based Wealth Management, we invite you to read Investing from a Position of Strength by Joseph J. Janiczek. A complementary digital copy is available at www.janiczek.com/ifapos.
About Janiczek & Company, Ltd.
For nearly a quarter century, Janiczek & Company, Ltd. has delivered comprehensive investment and wealth management services that are tailored to the needs of high net worth investors
(individuals with portfolios of $1 to $20 million) and ultra-high net worth investors (individuals with portfolios of $20 million+). The firm specializes in serving accomplished business owners and C-level executives, with a particular specialty in assisting those experiencing a life-changing liquidity event. Named among the top, best and most exclusive wealth advisors in the country multiple times, the company has been a pioneer in Evidence Based Investing and Strength Based Wealth Management™. Serving clients across the country on a fee-only, fiduciary basis, we welcome opportunities to serve like-minded clients within our exclusive niche. For more information go to www.janiczek.com or call us at 303-721-7000.
Bibliography
- “Dalbar’s 20th Annual Quantitative Analysis of Investor Behavior 2014.” Dalbar Inc., 2014.
- Gary P. Brinson, L. Randolph Hood and Gilbert L. Beebower, “Determinants of Portfolio Performance.” Financial Analysts Journal. (January-February 1986).
- Gary P. Brinson, Brian D. Singer, and Gilbert L. Beebower, “Determinants of Portfolio Performance II: An Update.” Financial Analysts Journal, (May/June 1991).
- Harry Markowitz, “Portfolio Selection.” The Journal of Finance, Vol. 7, No. 1, (March 1952): 77-91.
- Janiczek & Company Ltd., analysis of Bloomberg data, 2014
- Christopher Geczy, Ph.D., “The New Diversification: Open Your Eyes to Alternatives.” BlackRock, Inc. (2014).
- John L. Maginn, CFA, Donald L. Tuttle, CFA, Dennis W. McLeavey, CFA and Jerald E. Pinto, CFA, Managing Investment Portfolios: A Dynamic Process, 3rd Edition. New Jersey: Wiley, 2007)
- Aye M. Soe, “S&P Indices Versus Active Funds (SPIVA®) U.S. Scorecard”. McGraw Hill Financial, (Year-End 2013).
- Janiczek & Company Ltd., analysis of Bloomberg data, 2014
- Russel Kinnel, “Lower Your Fees, Boost Your Returns.” Morningstar FundInvestor. (May 22, 2014).
- Joe Light, “Upside: How to Find a Fund Manager Who Can Beat the Market.” Wall Street Journal, (January 11, 2013).
- K. J. Martijn Cremers and Antti Petajisto, “How Active is Your Fund Manager? A New Measure That Predicts Performance.” Yale School of Management, (March 31, 2009).
- Ibid
- “Hedge Fund Trend Monitor: Consumer Discretionary exposure hampers hedge fund returns”, The Goldman Sachs Group, Inc. (August 20, 2014).
- Internal Revenue Manual Code 9.1.3.3.2.1 (05-15-2008) 26 USC §7201 – Avoidance Distinguished from Evasion
- Janiczek & Company Ltd., analysis of Bloomberg data, 2014
- Janiczek & Company Ltd., analysis of Bloomberg data, 2014
- James P. O’Shaughnessy, What Works on Wall Street: A Guide to the Best-Performing Investment Strategies of All Time. (New York: McGraw-Hill, 2005)
- Joel Greenblatt, The Little Book That Beats the Market. (New Jersey: Wiley, 2006)
- “NDR Global Balanced Account Model: Monthly Data 1990-01-31 to 2014-05-3.” Ned Cavis Research, Inc. (2014).
- Janiczek & Company Ltd., analysis of Bloomberg data, 2014
- Janiczek & Company Ltd., analysis of Bloomberg data, 2014
- Michelle A. Samaad, “Financial Advisors Stay the Course Amid Market Volatility.” Credit Union Times. (August 14, 2008).
- Mark Gongloff, “Where Are They Now: The Beardstown Ladies.” Wall Street Journal, (May 1, 2006)
- Jonathan Cheng, “Shares Are Too Tempting Not to Bite.” Wall Street Journal, (March 14, 2012).
IMPORTANT DISCLOSURE INFORMATION
Please remember that past performance may not be indicative of future results. Different types of investments involve varying degrees of risk, and there can be no assurance that the future performance of any specific investment, investment strategy, or product (including the investments and/or investment strategies recommended or undertaken by Janiczek & Company, Ltd.), or any non-investment related content, made reference to directly or indirectly in this newsletter will be profitable, equal any corresponding indicated historical performance level(s), be suitable for your portfolio or individual situation, or prove successful. Due to various factors, including changing market conditions and/or applicable laws, the content may no longer be reflective of current opinions or positions. Moreover, you should not assume that any discussion or information contained in this newsletter serves as the receipt of, or as a substitute for, personalized investment advice from Janiczek & Company, Ltd.. To the extent that a reader has any questions regarding the applicability of any specific issue discussed above to his/her individual situation, he/she is encouraged to consult with the professional advisor of his/her choosing. Janiczek & Company, Ltd. is neither a law firm nor a certified public accounting firm and no portion of the newsletter content should be construed as legal or accounting advice. If you are a Janiczek & Company, Ltd. client, please remember to contact Janiczek & Company, Ltd., in writing, if there are any changes in your personal/financial situation or investment objectives for the purpose of reviewing/evaluating/revising our previous recommendations and/or services. A copy of the Janiczek & Company, Ltd. current written disclosure statement discussing our advisory services and fees is available upon request.
Please Note: Rankings and/or recognition by unaffiliated rating services and/or publications should not be construed by a client or prospective client as a guarantee that he/she will experience a certain level of results if Janiczek & Company, Ltd. is engaged, or continues to be engaged, to provide investment advisory services, nor should it be construed as a current or past endorsement of Janiczek & Company, Ltd. by any of its clients. Rankings published by magazines, and others, generally base their selections exclusively on information prepared and/ or submitted by the recognized adviser.
TM & Copyright 2014 by Janiczek & Company, Ltd., all rights reserved. Strength Based Wealth Management™ is a trademark of Wealth with Ease, LLC, which also has patents-pending on Optimal Systems and Methods for Optimizing Wealth. All rights reserved. Copying or redistributing this document in any form is prohibited unless otherwise authorized in writing by Janiczek & Company, Ltd. For more information call 303-721-7000.
Janiczek & Company, Ltd.
8400 E. Crescent Parkway, Ste 160
Greenwood Village, CO 80111
303-721-7000
www.janiczek.com
info@janiczek.com