
The stock market’s rally off the March lows has been nothing shy of spectacular, but this has left the markets exposed to a great risk: stretched sentiment.
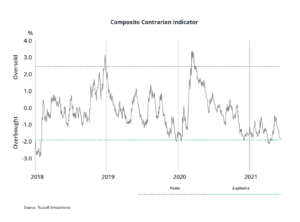
Our Chart of the Month (above) is a contrarian indicator that measures investor sentiment. As you can see, sentiment is near overbought levels but not yet signaling dangerous levels of euphoria like we experienced in 2018.
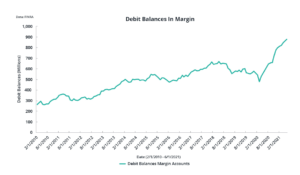
Margin debt, see “Debit Balances in Margin Accounts”, is at record highs and up 58% from 15 months ago, supporting the excess optimism currently in the markets.
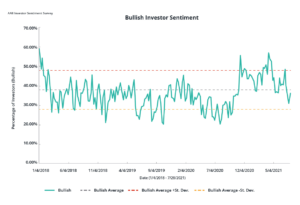
Another chart of interest is the AAII Investor Sentiment Survey. Giving us weekly insight into the mood of investors, the “Bullish Investor Sentiment” chart shows that levels are trending well within their respective standard deviations. An observation to note here: the most recent bullish reading jumped 5.5% to 36.2%, yet it has been trending below its historical average of 38.5% for the trailing three weeks.
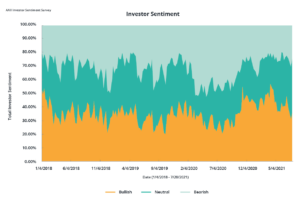
“Investor Sentiment” chart displays a notable move higher in the “Neutral” sentiment, 39.7% as of 7/28, which topped its highest level in nearly 19 months.
Negative catalysts in the form of COVID variants, a recalibration in future earnings estimates, and/or an expeditious maturation of the business cycle will keep investors on high alert, and we will watch this survey as it shifts between bullish, neutral, and bearish levels.
Takeaway: Investor sentiment has remained lofty over the course of the market’s advance, and it has reached similar pre-pandemic overbought levels. These indicators will continue to be monitored and support our portfolios being underweight risk (beta) in certain asset classes.
Navigating the markets during these challenging times can be overwhelming. If you are interested in learning more about our comprehensive wealth and investment management services, please contact Cathy Wegner, Director of New Client Engagements, 303-339-4480 or cwegner@janiczek.com.