Passive investing as the foundation for an optimal portfolio
To investors who have spent years accumulating wealth through active entrepreneurship or business management, the notion of being “passive” may have a negative connotation. But when designing a portfolio strategy, evidence suggests that passive investing produces superior results with lower expenses than one built around active trading.
In a passive investment strategy, an investor is not looking to beat the market. Rather, the goal is to gain exposure to the broader market – all the good and all the bad – at the lowest possible cost. (Source: Managing Investment Portfolios: A Dynamic Process)
The broader market is represented by indices, for example the Standard & Poor’s 500 Index for stocks and the Barclays Aggregate Bond Index for bonds. Investors do not buy into an index per se, but in funds that closely mimic the index.
In the investment management world, there are marketplaces in which assets are efficiently priced, and the odds of outperforming those markets’ respective indexes are small. The vast majority of studies documenting active managers’ track records conclude that 60%-85% of active managers fail to beat their respective benchmarks over the long term. The most commonly cited factors include:
Fees. The average domestic equity manager will cost 0.80% to 1.40% of an investor’s assets, while the equivalent passive security (index fund or ETF) will cost 0.10% or less. The difference in fees is strikingly similar to the underperformance gap of active managers uncovered by several research studies. (Based on Janiczek & Company, Ltd. analysis of 2014 Bloomberg data)
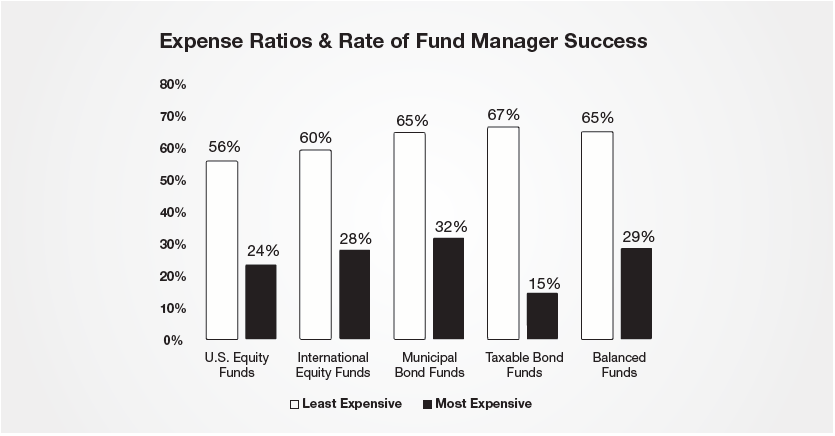
Investment research firm Morningstar studied the relationship between fees and investment performance over a 5-year period ending June 30, 2008. They defined “success rate” as “the percentage of funds that not only survived but also outperformed.” Clearly the cost of the active manager plays a significant impact on the future success.
“Closet Indexing.” Research confirms that most managers are mirroring their benchmarks more than ever. According to New York University professor Yakov Amihud, the returns of the median actively managed fund are 93% correlated with those of the overall market. By mirroring the market, the typical active fund is effectively an expensive ‘closet index’ fund. Dr. Amihud’s study further shows that, for every 10% reduction in this relationship, investors can expect an increase in returns of 0.8% annually.11
Further, K. J. Martijn Cremers and Antti Petajisto find a negative relationship between the size of a fund and its active share. In other words, the larger the fund, the more likely it is to be a closet indexer. While some of this may be for the simple reason that it has more money to deploy within a certain space, another factor may play a role: compensation. Fund size results in more revenue and incrementally lower costs for the fund manager. Unfortunately, this may put the interests of the fund manager at odds with those of the fund’s investors.
Suffice it to say closet index funds deliver benchmark-like returns at 10 times the cost of the passive alternative, and should be avoided.
Passive strategies play a very important role in most portfolios. For many markets, securities are highly efficiently priced, so reducing costs and gaining broad exposure via passive securities serves as a great foundation for one’s portfolio.
Limitations to Passive Investing
Passive investing does have its limitations. First, you’re guaranteeing a slight underperformance versus the benchmark due to the expenses of the passive security. Granted the lag is small, but investors will never outperform the index.
More importantly, selecting a passive security in which to invest still requires some research. For example, traditional stock indices are market-capitalization weighted. This means that as a stock becomes more expensive (and potentially riskier), it gains a larger weight in the index. Bond indices present a similar issue: The more debt a company or country issues, the greater the weight they have in the index. But is a passive bond investor’s goal to gain exposure to the most leveraged companies or countries in the market?
While the creation of new indices has helped overcome these drawbacks, they may have introduced a new problem. Let’s say a new index equal weights its components. Further, in order to, remove other risks, perhaps the index limits its components to higher quality issuers only. By eliminating presumed risks, the new indices are effectively making an actively managed decision.
“Active Share” insights from Yale
The collective failure of active managers to beat their benchmarks has been well researched and documented. That said, a relatively new measure introduced in 2009 by Cremers and Petajisto provides investors with a new tool for selecting active managers. Their report entitled “How Active Is Your Fund Manager? A New Measure That Predicts Performance” defined active share as the percentage of stocks in a portfolio that differ from the portfolio’s benchmark. For example, let’s say a manager is benchmarked to the S&P 500 Index, but the manager owns none of the 500 stocks in that index. His active share would be 100%. Conversely, if a manager owns all 500 stocks in the S&P, his active share would be 0% – a classic “closet index.”
Examining over 2,500 mutual funds from 1980-2003, the professors found that the managers with the greatest active share outperformed their benchmarks by 1.13% annually, net of fees. On the other hand, the managers who looked the most like their benchmarks generated returns that lagged by 1.42% annually, net of fees. The authors also found managers increasingly migrating to the “closet index” camp over time. The percentage of funds with active share over 80% fell from 58% in 1980 to just 28% in 2003, while those with active share of less than 60% rose from 1.5% to 40.7%, respectively.
This study went on to confirm that funds with a stated objective of running portfolios with fewer, concentrated positions (often called “focused”) have greater active share and, therefore greater alpha (an indication of the value added by the active manager) net of fees. Although the study did not examine the impact of taxes, it logically follows that a concentrated portfolio benefits from lower trading costs and taxable capital gains since it has fewer positions to trade.
Examining the data from another perspective, we find that small- and mid-cap managers tend to have greater active share and, therefore, greater alpha net of fees, since there are far more small company stocks to choose from than large ones.
Active management works best in less efficient markets
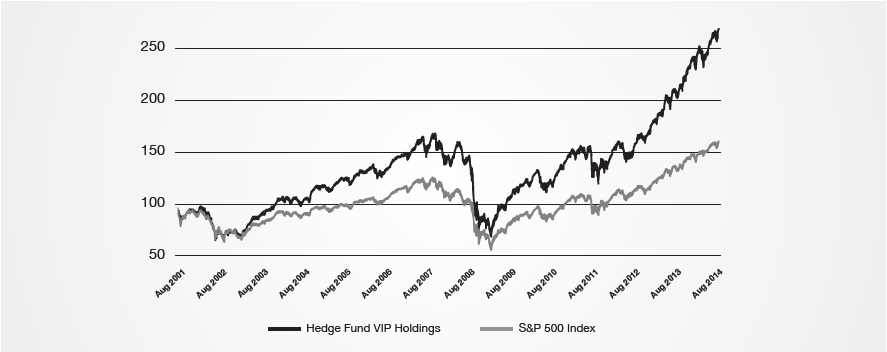
Similar results can be found among less regulated money managers, such as hedge funds. David Kostin of Goldman Sachs has tracked 775 hedge funds, with aggregate equity positions totaling $1.9 trillion, since 2001. Hedge funds typically seek hidden value in more obscure, less efficient or less popular stocks. By examining the equity positions that appear most frequently among the top 10 holdings (what Kostin calls the “stocks that matter most”), we see the stocks in which hedge fund managers have the greatest convictions. (Source: “Hedge Fund Trend Monitor: Consumer Discretionary exposure hampers hedge fund returns”, The Goldman Sachs Group, Inc. August 20, 2014.)
The track record of this list indicates that managers who have the ability and freedom to uncover value in the market can add to investment returns. Since the data began in 2001, the hedge funds’ top picks have returned 193.4%, or 8.6% per year. This strong performance beats the S&P 500 Index’s 108.5% return, or 5.7% annualized. Over 14 calendar years (including partial year data for 2001 and 2014), the hedge funds’ top picks have outgained the S&P 500 71% of the time.
Key Insight #2: In efficient markets where the odds of outperforming the benchmark are small, investors are better served by taking a broad passive approach. They gain the exposure to the asset class they desire, and do so at the lowest cost. In less efficient markets, investors could benefit from a carefully selected manager who seeks truly active management.
This article is adapted from “Evidence Based Investing for High & Ultra-High Net Worth Investors,” a white paper published by Janiczek & Company, Ltd. The full paper is available here. Also see our article on asset allocation.